Author Archives: Grant Blank

The challenge of measuring social network site use

Survey research, which is at the core of the OxIS project, presents several measurement challenges. Establishing reliability is especially difficult when measuring concepts where observational data might yield better results, such as usage of different online services. Therefore, the way in which respondents are asked about online activities can have a major impact on the quality of self-reported data. Sometimes a different question wording or different structure of possible answers can yield different results.

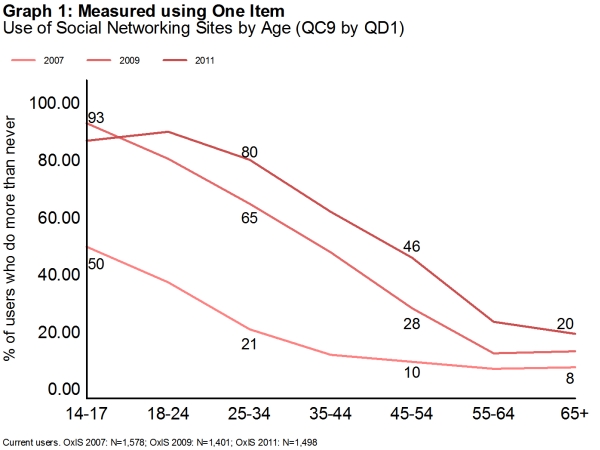
Using OxIS data, we explore this in the case of social network site (SNS) use. We compare levels of self-reported SNS use for two different measurement approaches. The results are reported in the graphs below, where proportions of SNS users among Internet users are plotted by age groups. To produce the first graph, SNS use was measured by a single item reading “How often do you use the Internet to check or update your profile on a social networking site such as MySpace or Facebook?” (QC9.l), where possible answers ranged from “Several times a day” to “Never”. Overall, 60% of Internet users claimed they do so more than never.

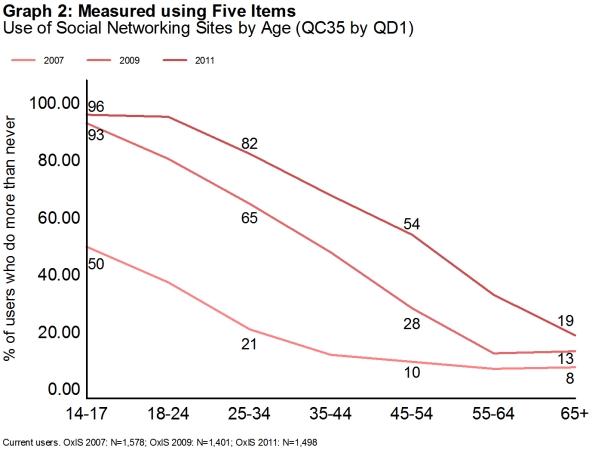
In the second graph, the measure of SNS use for 2011 is responses to a series of five dichotomous items. “[Do you] use any of the following: a. Facebook; b. LinkedIn; c. Twitter; d. An online dating site like eHarmony, Match.com or Zoosk; e. Another social networking site?” (QC35). Any respondent answered “yes” to any of those five items was coded as a SNS user. Using this approach 66% of Internet users reported using social networking sites, about 6 percentage points higher.

The 2007 and 2009 data are the same in both graphs. The only SNS item on the 2007 and 2009 questionnaires was the question “How often do you use the Internet to check or update your profile on a social networking site such as MySpace or Facebook?”
Caption

Ever since we began to measure social network site use there has been a strong relationship to age.
 

Caption

When we measure social network site use by several items it is slightly different than when we measure it using a single item.

Comparison of the 2011 lines (dark red) in both graphs shows that two different measures generate different results not only in the overall population but also across age groups. In the Five Item graph, the 2011 line is always above the 2009 line, indicating an increase in SNS use across all age groups, with the biggest jump among 45- to 54-year olds, 26 percentage points. By contrast, in the One Item graph the differences in SNS use between 2009 and 2011 are smaller, the increase among 45- to 54-year-olds is only 18 percentage points. Interestingly, the One Item graph shows a drop in SNS use among the youngest users from 2009 to 2011 and among the oldest it is at the same level in 2009 and 2011.

The above example shows that using different approaches to measuring online activities yields different results and different interpretations. The One Item graph is more consistent with data from previous years. The Five Item graph yields higher percentages and probably more accurate results. This is because asking about all five items focuses respondents on social networking activity and helps them recall all the kinds of social networking sites they visit.

Data! We have Data!

The 2011 wave of data collection is finished and we have 2,057 respondents. We have gone through several waves of data cleaning. For example, we were able to recover many missing occupational codes. In some cases, we found that the interviewer had written down an abbreviation for the occupation. When the person coding the occupation did not know the abbreviation, it was coded as missing data. With some work we found what the abbreviations meant and we were able to code occupation for 21 additional cases.

Occupation is a critical variable because it is the basis for so many other key variables. Socio-economic status, occupational prestige, and class status are all based on occupation, so minimizing the number of missing cases is very important. We are satisfied that we now have a clean dataset. It is a great feeling to work with a new dataset and be able to get on with the work for the 2011 Report.

The data collection effort required about 5 weeks and contacted 4,160 people. 1,324 refused to participate for various reasons, ranging from being not interested, ill, or unable to speak English. The resulting response rate was 51.4%. This is considerably lower than the 2009 response rate of 61.8%. The contractor who collected the data, ICM, reports that response rates have been falling for face-to-face surveys, and they say that this response is higher than the typical response rate that similar surveys have achieved recently.

When we looked at the gender, age, and social economic grade breakdowns, they are usually within 1% of the same category in 2009. In only two cases is it larger: the 35-44 year-old group is 16% in 2011, compared to 19% in 2009. It is 18% in the population as a whole. The over-65 age-group is 28% in 2011, compared to 26% in 2009. It is 19% in the population. The relatively close match to the 2009 results suggests that the deviations are ordinary garden-variety sampling error. This suggests that the lower response rate did not damage the representativeness of the survey.

We are constructing variables, creating graphs, and preparing analyses for the 2011 Report, which will be released in October.

In the Field!

Data collection has begun for the 2011 wave of the Oxford Internet Surveys, with ICM Research hired to collect a random sample of about 2,000 British respondents. We expect to be in the field for four to six weeks.

The questionnaire is long, about 40-45 minutes for most Internet users, but shorter for non-users and ex-users. This is about the same length as the 2009 survey. We removed questions that were no longer relevant, like the number of narrow-band users (there were only 34 in 2009). We have added items on social media use, a standard political efficacy scale, and items on occupation and use of the Internet at work.

For the occupation codes we are using the Standard Occupation Codes 2010 (SOC2010), at the 2-digit level: this will give us a fairly detailed occupation variable for the first time in OxIS. We intend to use this variable directly and as part of a socio-economic status (SES) scale.

Social media use has blossomed very quickly in the past two years, and we added nine items to measure it. The social media questions ask how often people use social media like FaceBook, MySpace, Twitter, Bebo, and LinkedIn. We also ask about specific uses such as how often respondents update their status, post photos, or check or change privacy settings.

An issue we hope to address is the extent to which respondents received news and information from social networking sites, rather than by going to news sites. We also want to know the extent to which respondents click on links in social networking sites as a substitute for a google search or clicking on a bookmark in their browser.

I’ll update this blog when we receive data.